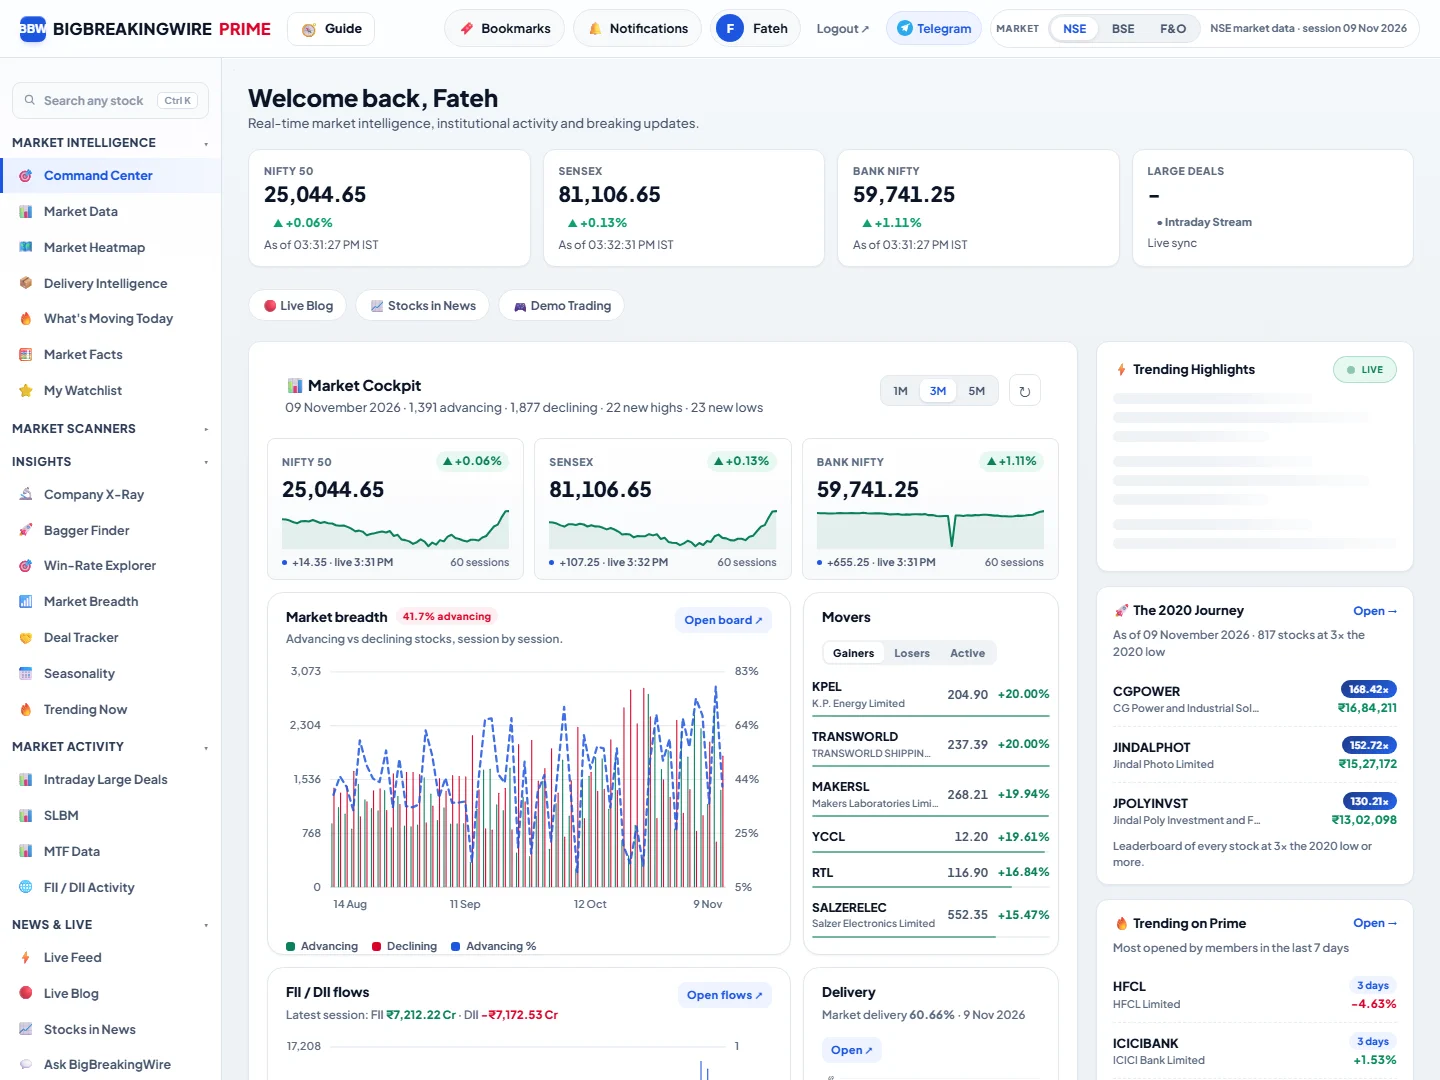
Command Center
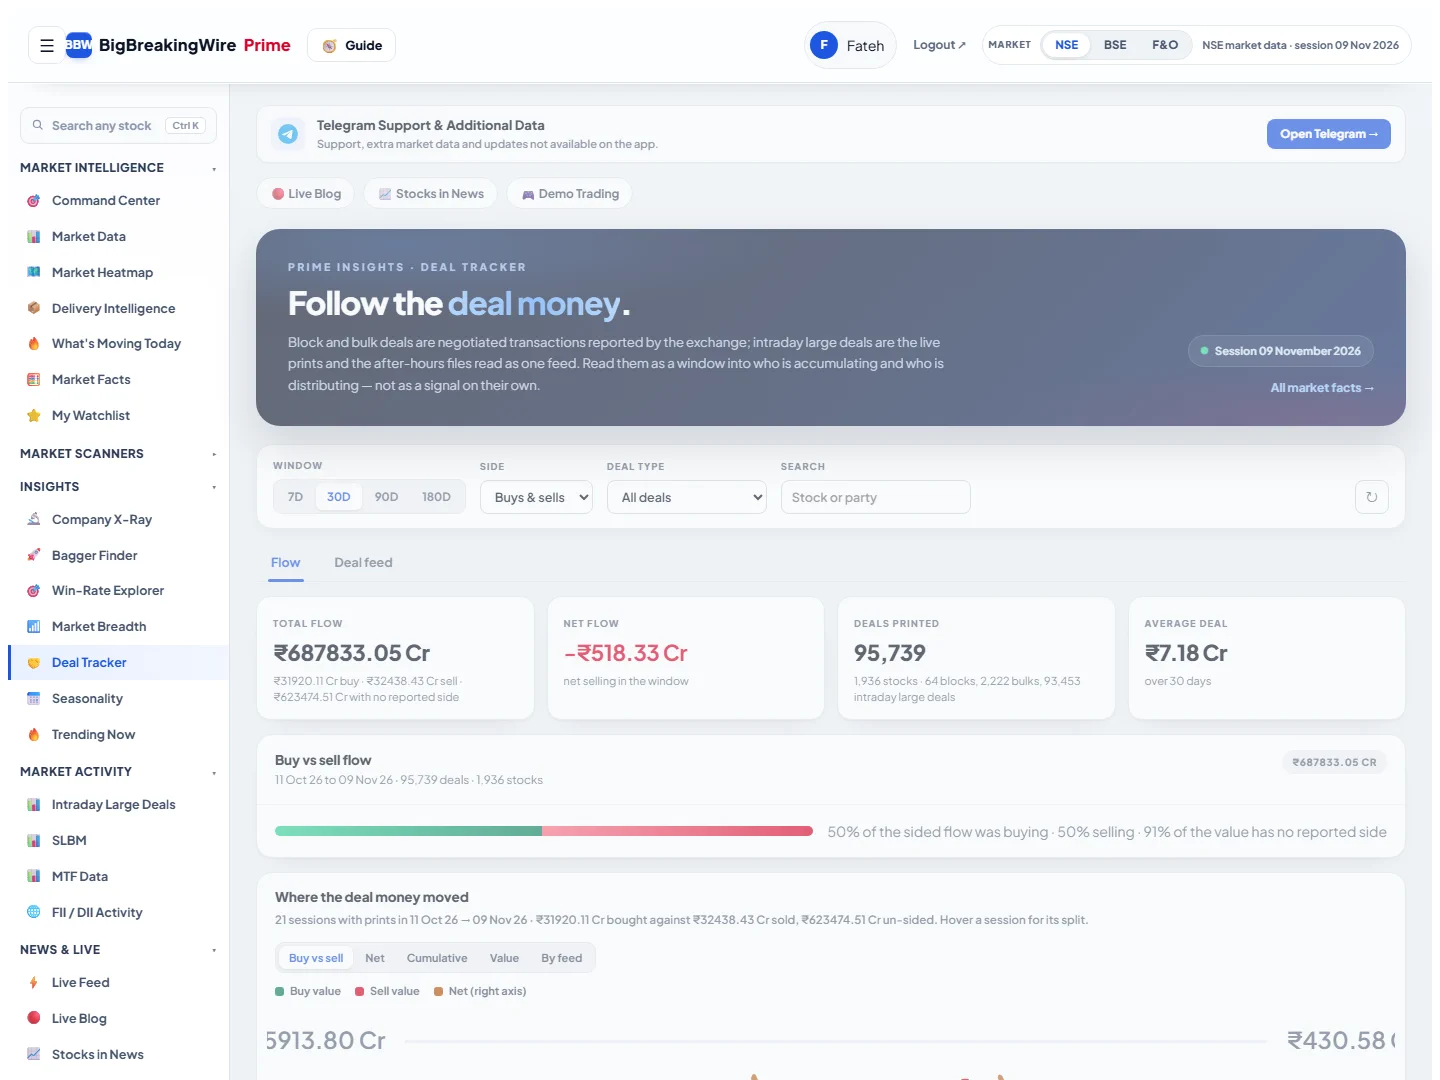
A dashboard bringing index quotes, completed-session breadth, market activity, delivery and deal summaries into one research starting point, plus an optional Weekly Data selector for the current week's sessions.
Read detailed guideGet to know every corner of BigBreakingWire Prime. One feature per page, with real terminal snapshots, clear walkthroughs and practical examples.

Historical examples explain the tools, not what to buy or sell. Past performance does not predict future results. Read the disclaimer.
Choose a category or search by feature, stock example or research question.
67 guides
Try a shorter search, choose another category or clear the filters.
Understand the session before investigating a stock.
A dashboard bringing index quotes, completed-session breadth, market activity, delivery and deal summaries into one research starting point, plus an optional Weekly Data selector for the current week's sessions.
Read detailed guideThe dashboard's market report browser: choose a stored report family and date, then inspect its raw, paginated rows.
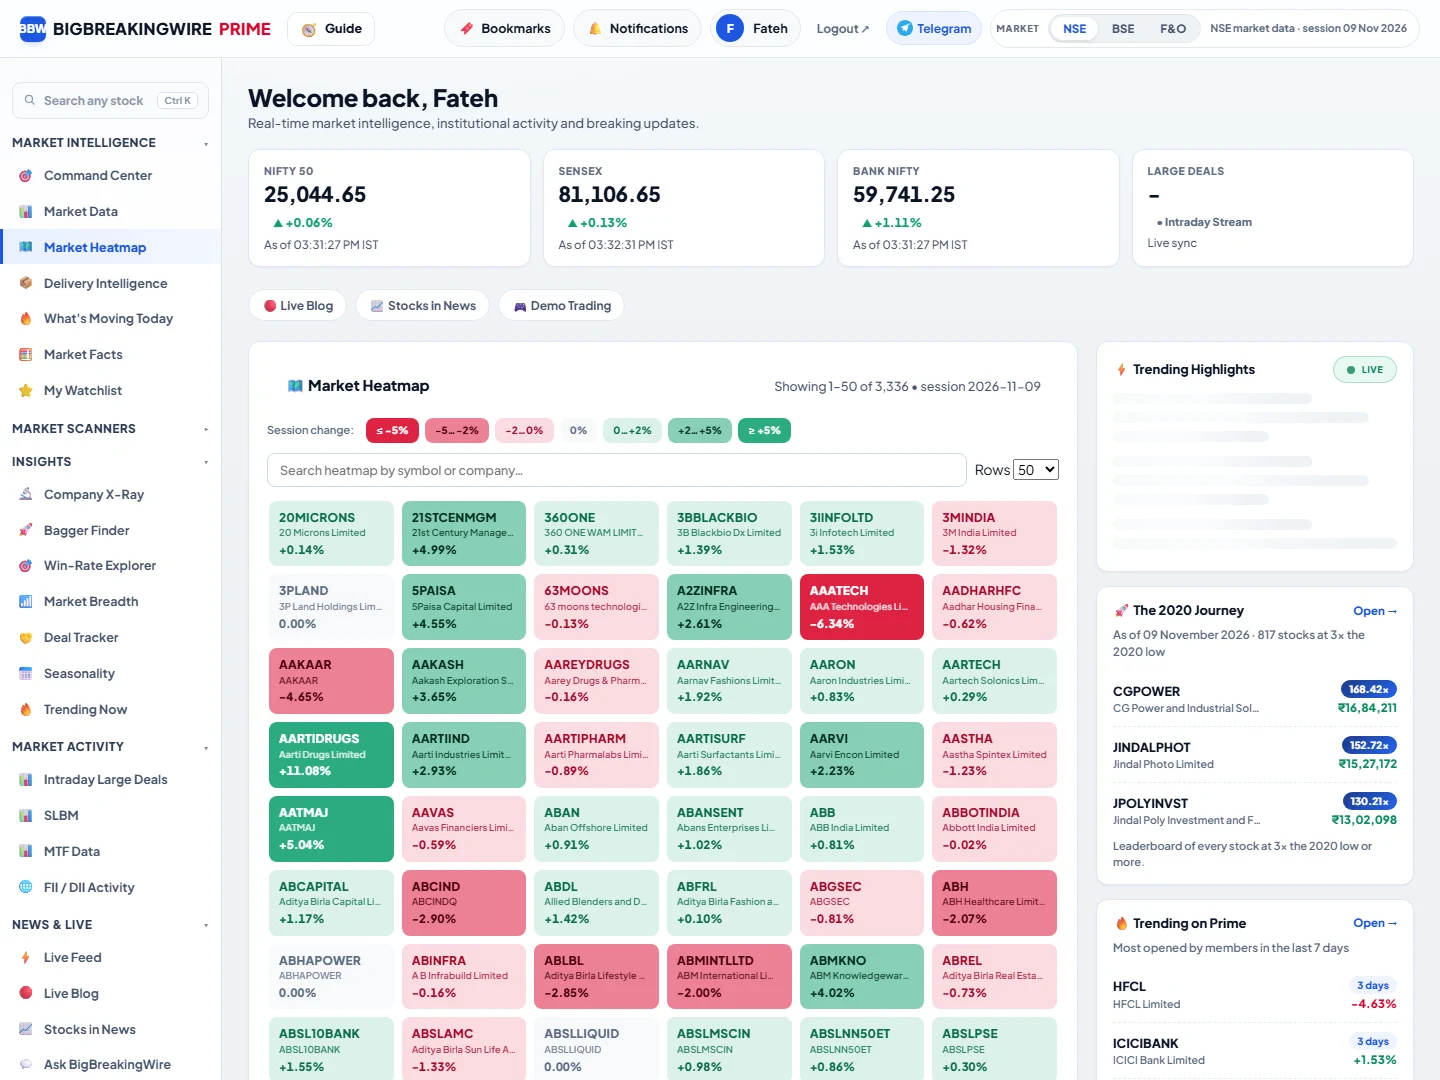
Read detailed guideEqual-sized stock tiles coloured by session percentage change, with search, change buckets and pagination.
Read detailed guideStock delivery percentages, comparisons with their own historical averages, and a market delivery trend for the covered liquid universe.
Read detailed guideAn enriched stock-activity shortlist showing price change, relative volume, activity score and explanatory signal chips.
Read detailed guideDefined market conditions presented as fact cards, with stock-list drill-downs where available.
Read detailed guideYour saved stock symbols with an enriched session table of price, activity, volume, delivery and signal explanations.
Read detailed guideTurn a research question into a list of conditions and matches.
Prebuilt scans and a genuine multi-stock condition builder, with ALL/ANY logic, condition groups, date selection and result controls.
Read detailed guideA single-stock analysis workspace: choose a company, setup direction and timeframe, then inspect preset verdicts, levels and available historical outcomes.
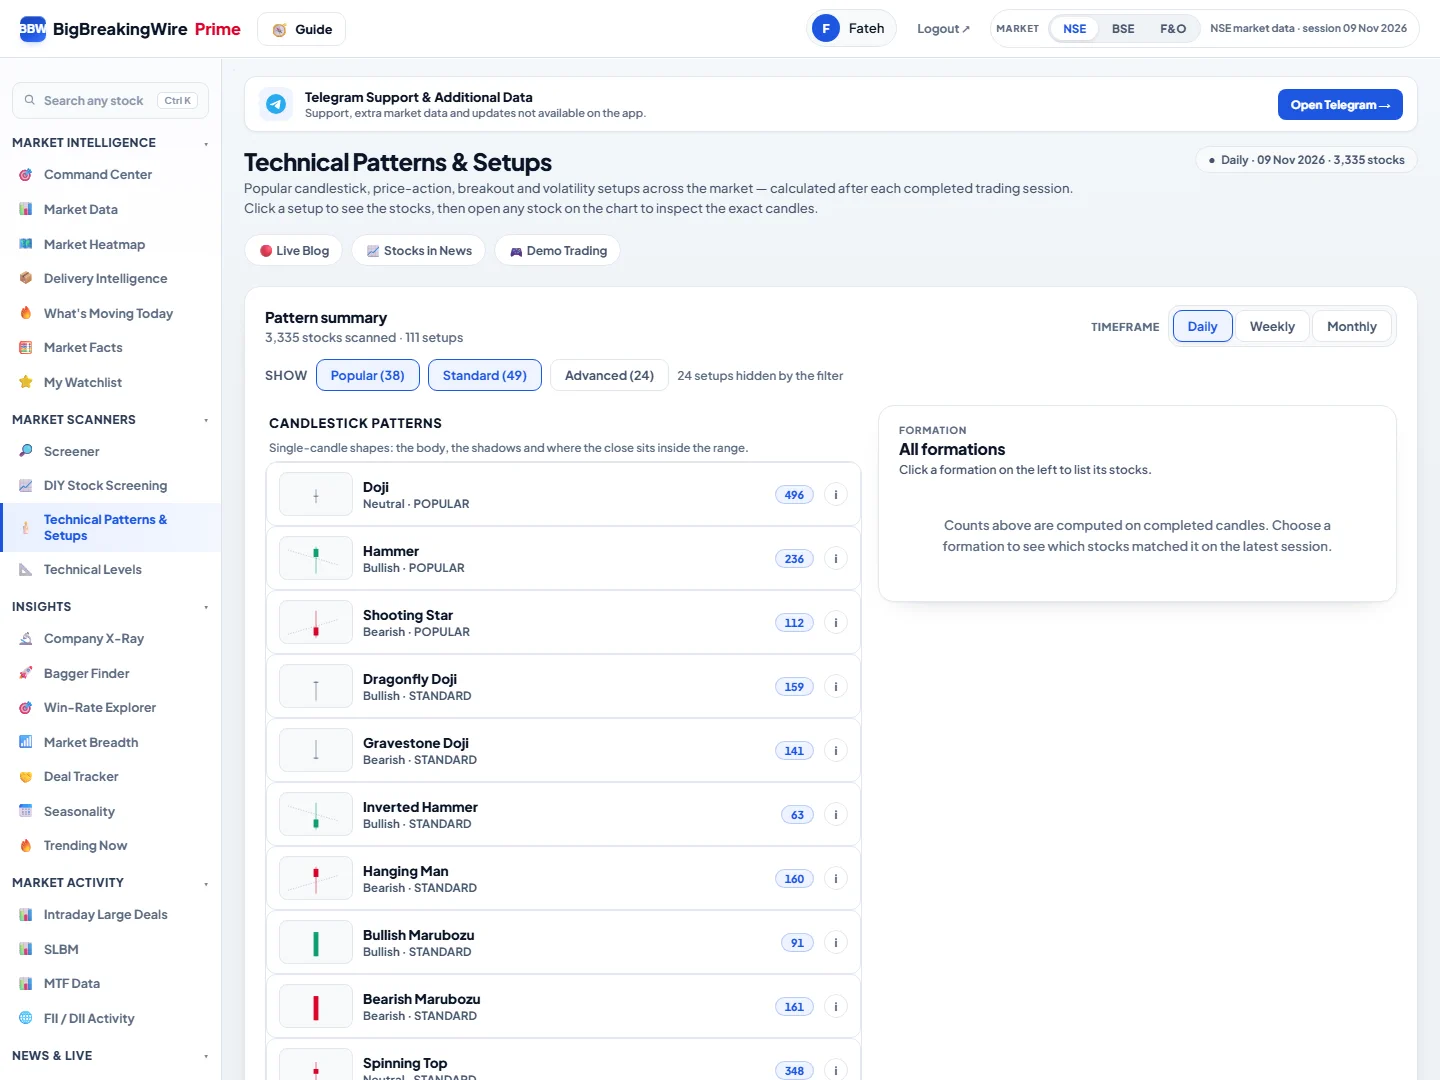
Read detailed guideA catalogue of completed-data candlestick formations and technical setups, with counts and matching-stock lists.
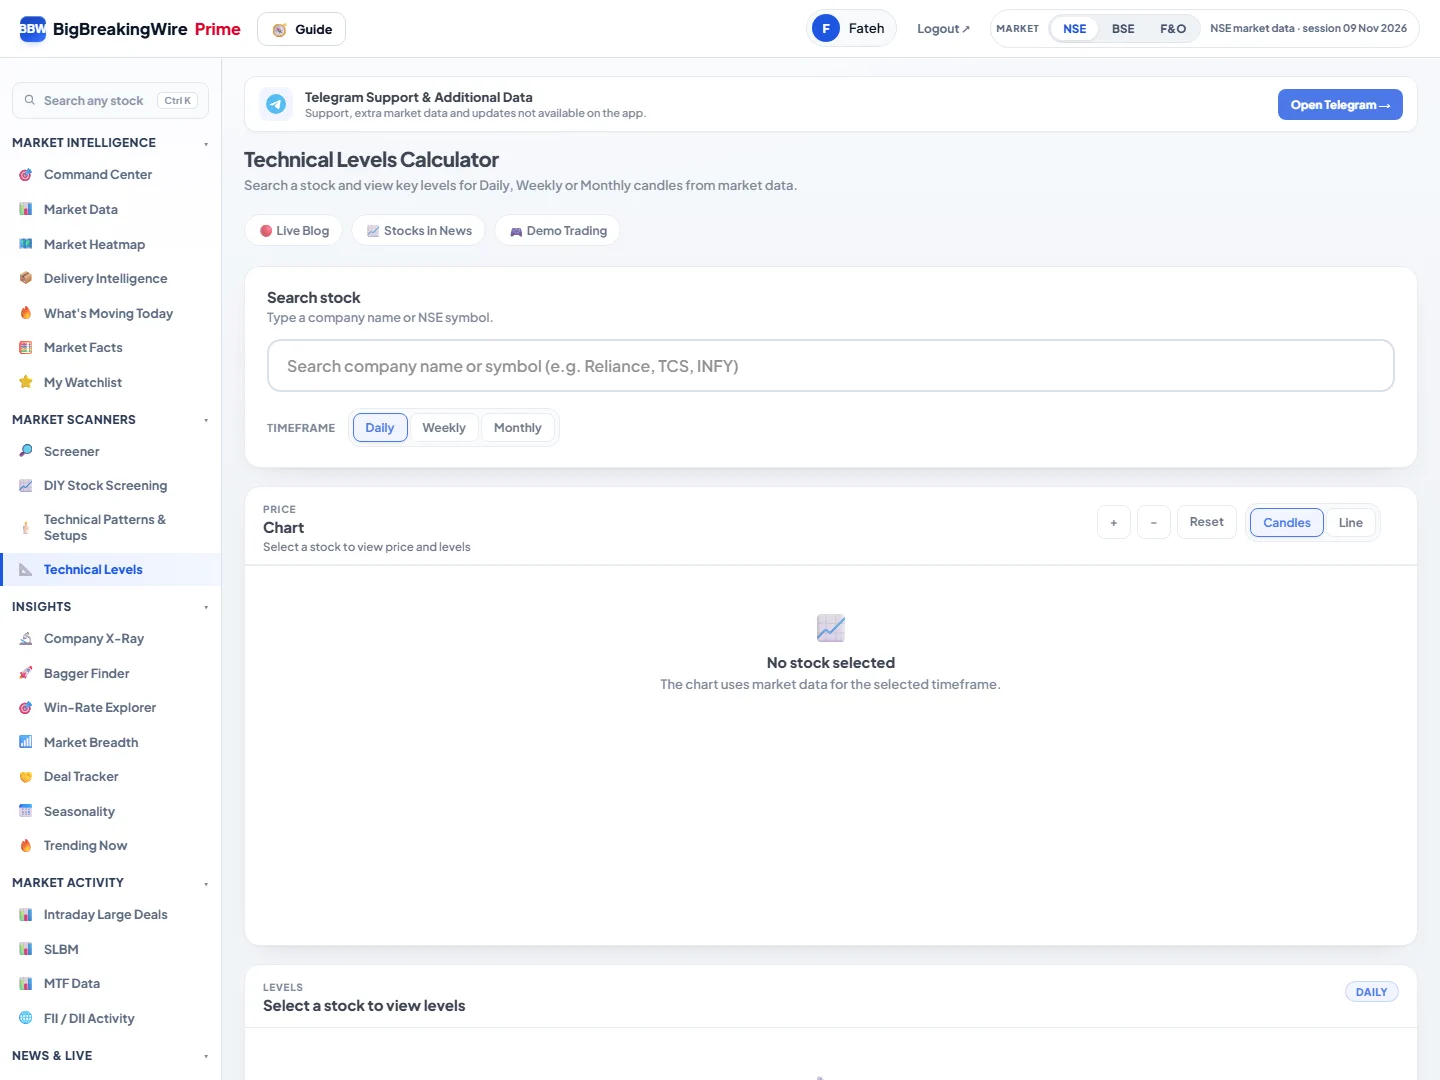
Read detailed guideA per-stock calculator and chart for breakout and breakdown levels plus moving-average support and resistance on a selected timeframe.
Read detailed guideNamed, reusable equity screener configurations with load, update, duplicate and delete controls.
Read detailed guideSubscriptions to supported screener signals for newly matching stocks on later sessions, with management in Subscriber Profile.
Read detailed guideLook beyond one candle: history, participation and company context.
One stock's quote, yearly range, delivery comparison, technical matches and recent deal records in a compact research view.
Read detailed guideA historical multiplier study from a selected year's low to the available latest close, including hypothetical ₹10,000 journeys.
Read detailed guideStored historical signal studies ranked by judged outcomes, with timeframe, outcome-horizon and minimum-sample controls.
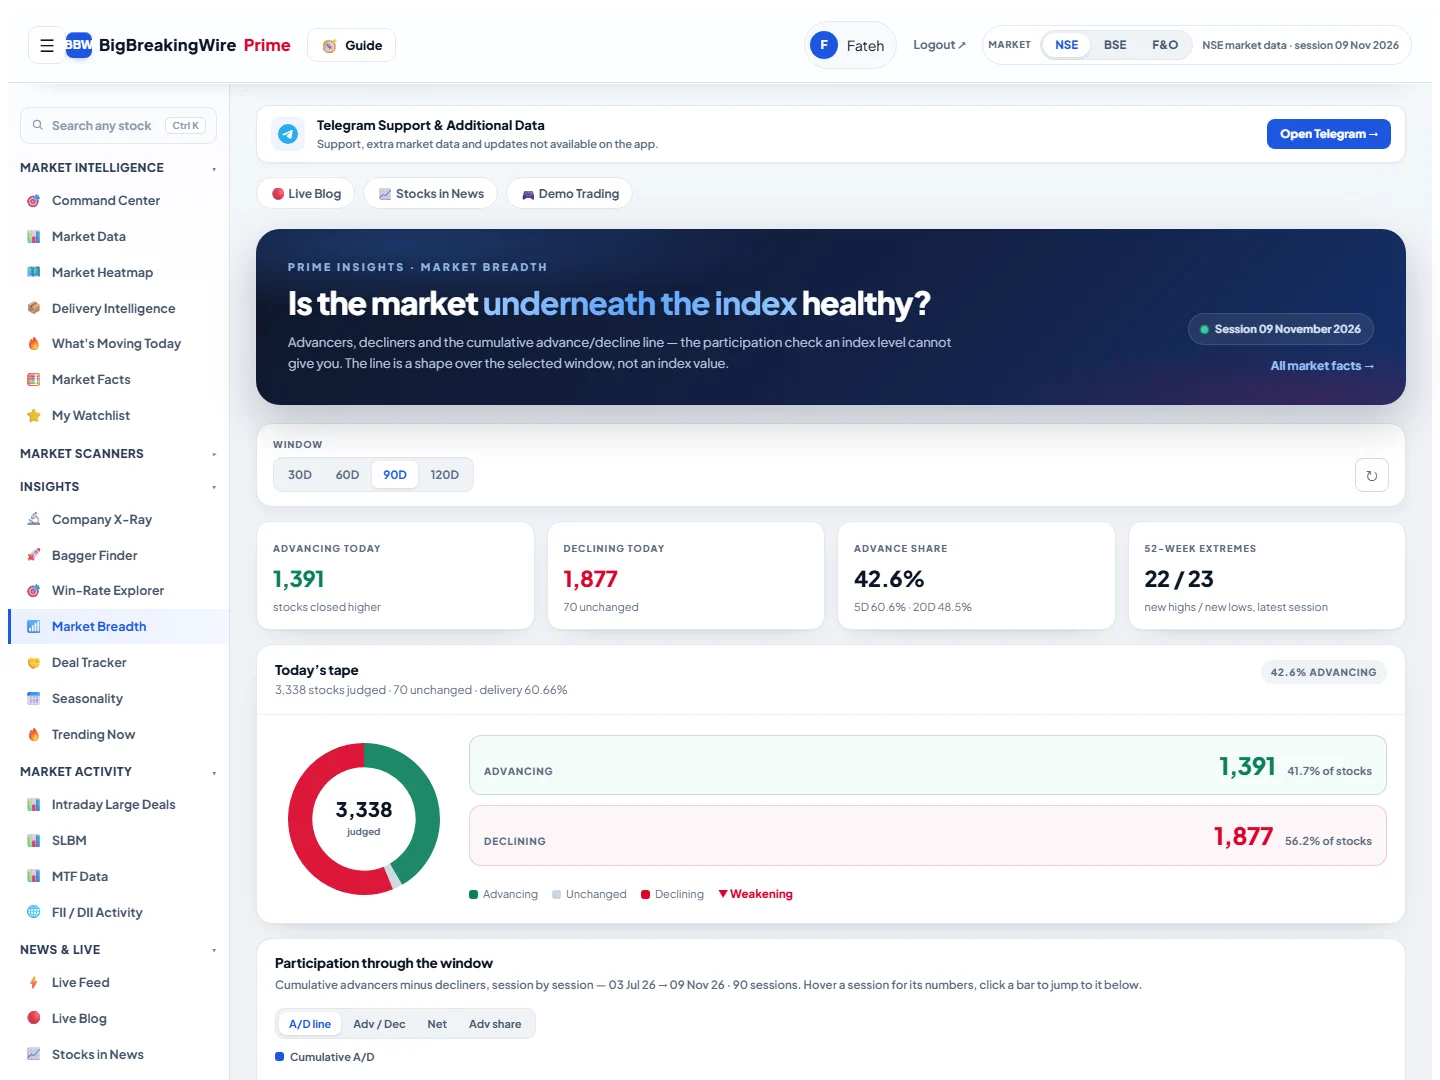
Read detailed guideHistorical participation measures with 30/60/90/120-session windows, latest-session 52-week extremes and session-by-session context.
Read detailed guideA historical view of stored block, bulk and intraday deal activity, with window, family, side and stock/party filters.
Read detailed guideA selected stock's calendar-month history, with year-by-month returns and average, median and positive-year summaries.
Read detailed guideA view of member research attention to stocks, with selectable recent windows and displayed price context.
Read detailed guideA dedicated equity company page with Overview, News, Fundamentals, Technical, Intraday Large Deals, Block Deals and Delivery sections.
Read detailed guideRead large trades, lending, funding and institutional flows.
A unified intraday-activity surface combining live observations and uploaded intraday TXT records, with totals and drill-downs.
Read detailed guideStored stock-lending-and-borrowing reports covering rent quotes, open positions, eligible securities and foreclosure records.
Read detailed guideMargin Trading Facility report balances, including aggregate funding movements and per-scrip funded quantity and amount.
Read detailed guideDaywise FII, DII and stored BSE participant cash-market flows, with Daily, Monthly and Yearly views, a net-flow chart and a full-day participant breakup.
Read detailed guideThe separate stored Block Deals report family with disclosed client, side, quantity, price and value fields when present.
Read detailed guideThe separate stored Bulk Deals report family, with available disclosed client, side, quantity, price and value records.
Read detailed guideThe Market Data browser's separate Short Selling family, with stored symbol, security name, trade date and short-quantity rows.
Read detailed guideConnect market updates with the instruments you research.
The dashboard's news/article feed, with category labels, timestamps, article reading and bookmark actions.
Read detailed guideEvent-based coverage with event selection and a timestamped timeline when updates are available.
Read detailed guideSearchable stock briefings with All, Today and This week filters and links to the full briefing.
Read detailed guideA plain-language research assistant with suggested questions about market summaries, stocks, screeners and activity.
Read detailed guideInspect the evidence, then rehearse with virtual money.
A stock-chart workspace for imported price history, indicators, technical snapshots and chart-analysis tools.
Read detailed guideA virtual-money stock portfolio with simulated buy/sell actions and valuation at imported end-of-day closes.
Read detailed guideExplore contracts, expiries and positioning from imported reports.
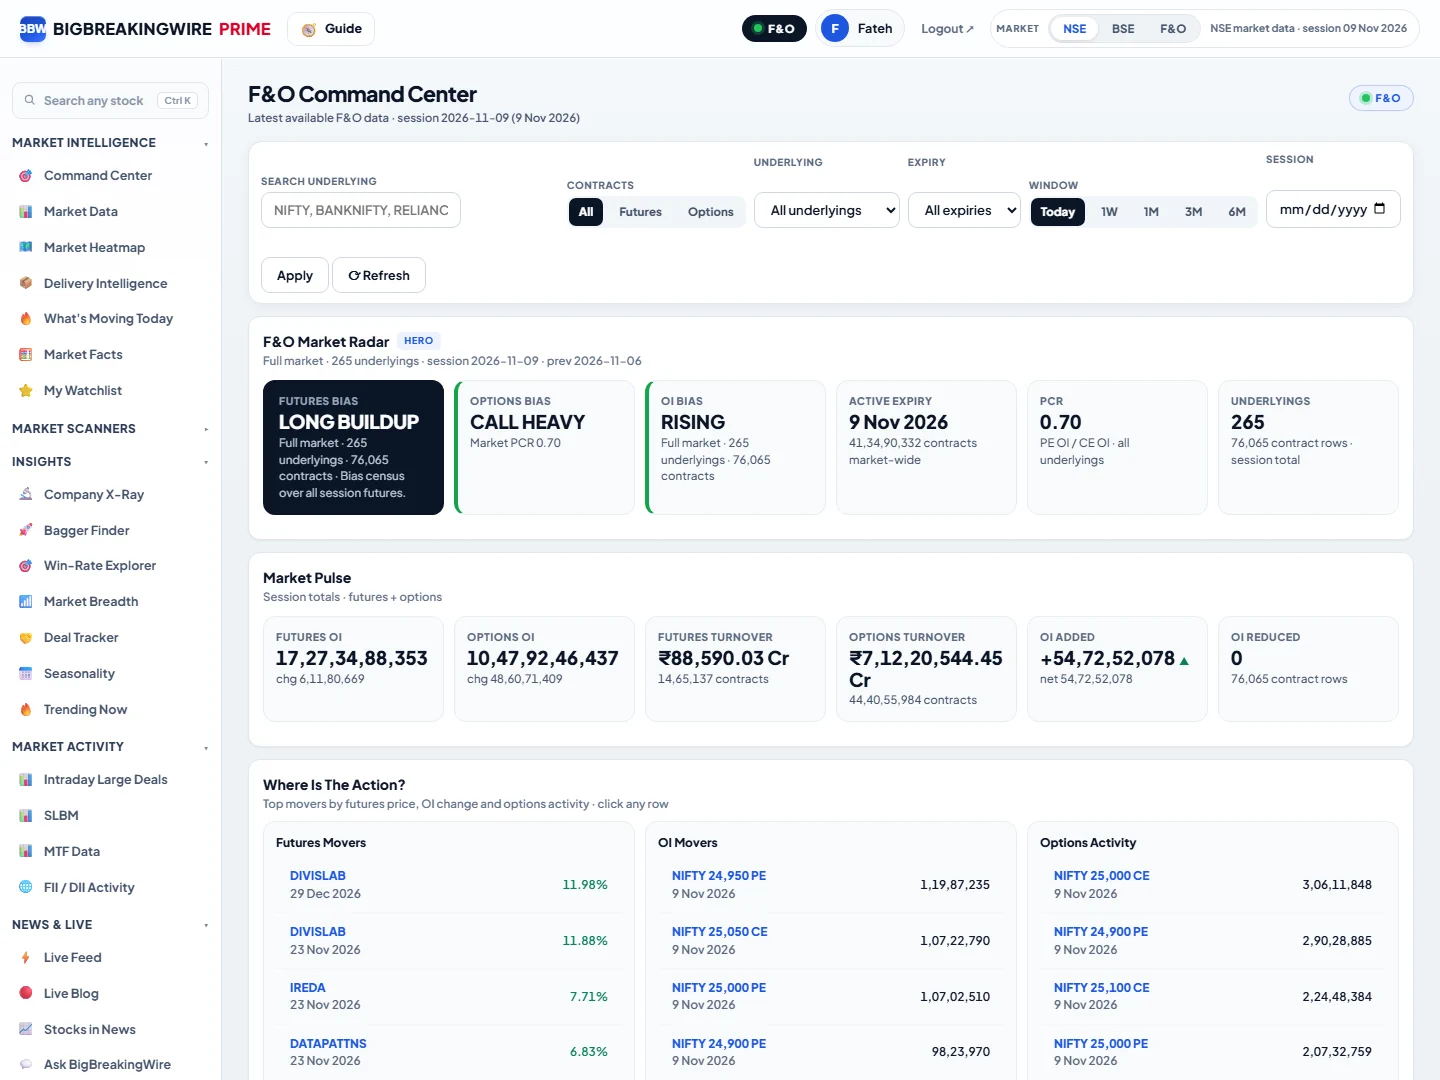
A derivatives dashboard combining scope controls, market radar, pulse totals, action and battlefield boards, option structure, story, momentum and six-month context, with links to deeper F&O tools.
Read detailed guideWhole-session futures and options OI, turnover and contract totals, with OI Added/Reduced computed from the session's net OI change.
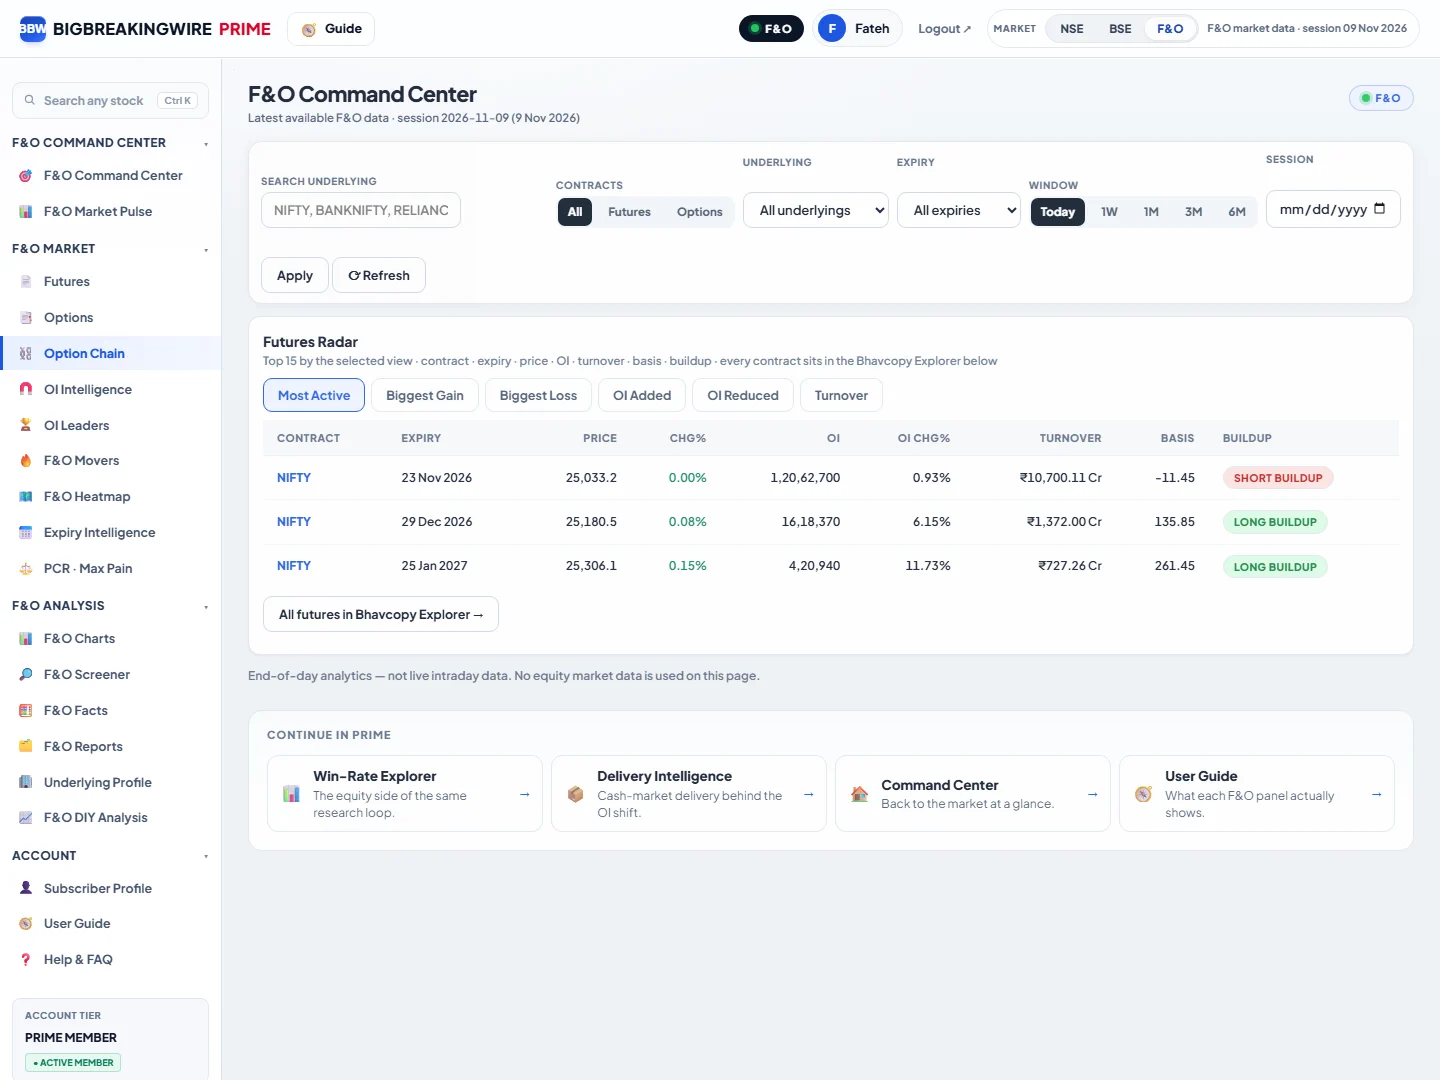
Read detailed guideA futures-contract table with expiry, close, price change, OI, OI change, turnover, basis and buildup fields.
Read detailed guideAn options-structure entry showing ATM context, call/put OI concentrations and a window of the shared strike ladder.
Read detailed guideA strike-by-strike calls/puts ladder for a selected underlying and expiry, with OI, changes, activity and price context.
Read detailed guideLeading OI additions and reductions from the loaded contract snapshot, accompanied by price change and buildup labels.
Read detailed guideUnderlying-level leaders aggregated from the loaded futures/options snapshot and ranked by a selected activity metric.
Read detailed guideShort derivatives-activity panels separating futures price moves, OI moves and option activity within the loaded scope.
Read detailed guideA strike-based options heatmap with OI, OI Change and Volume modes for the chosen underlying and expiry.
Read detailed guideNearby expiry cards for an underlying, showing days to expiry and available OI, PCR, max-pain and turnover context.
Read detailed guidePut/call-ratio cards and a max-pain context derived from stored option data, with a fixed latest-30-session history strip.
Read detailed guideAn entry into charting stored derivatives contracts, with exact-contract links required when researching a particular option or future.
Read detailed guideThe derivatives Scan Lab: preset analyses for price/OI buildup, activity, walls, PCR and basis, with a timeframe selector.
Read detailed guideDerivatives fact cards summarising stored extremes and conditions, with a leading member and calculation text where available.
Read detailed guideStored derivatives report-family coverage and raw tables, including a searchable, paginated Bhavcopy Explorer.
Read detailed guideOne underlying's available derivatives summary, active futures, expiry ladder and OI/PCR context.
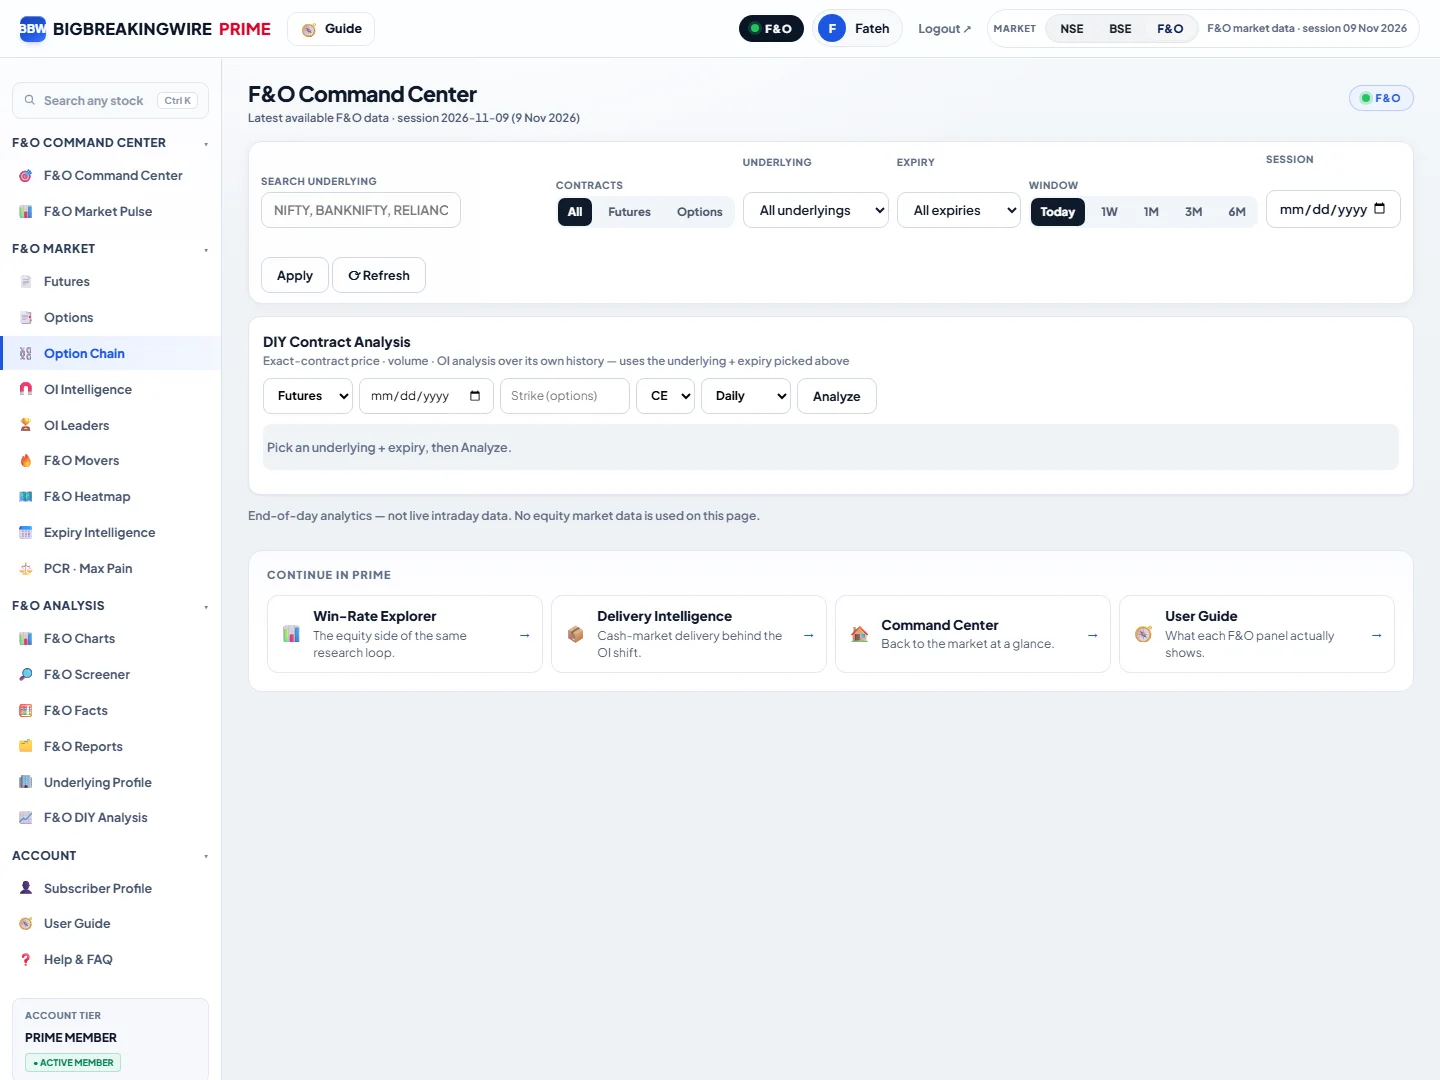
Read detailed guideHistory analysis for one selected futures or options contract, using kind, expiry, strike/side and timeframe controls.
Read detailed guideDeep-linked pages for one exact option or future, with its own snapshot, chart, history and available technical calculations.
Read detailed guideNamed saved F&O scopes for restoring instrument-kind, date, underlying symbol and expiry selections.
Read detailed guideA lazily loaded derivatives section that ranks underlyings by a 0–100 unusual-activity score built from volume versus its own median and OI change.
Read detailed guideManage access, review editions and find help.
Account identity, membership status, available plan actions, password change, payment history and invoice access.
Read detailed guideDaily and weekly digest editions, a dashboard archive tab, a standalone reader and per-member section customisation.
Read detailed guideA searchable, static learning library with one detailed page per feature, terminal snapshots, examples and practice checklists.
Read detailed guideA searchable FAQ with category filters and expandable answers about terminal features and account use.
Read detailed guideLearn the shared controls that connect the terminal.
A shared stock-search palette with direct actions into supported company research pages.
Read detailed guideThe shared header control for selecting NSE equity, BSE equity or the derivatives workspace.
Read detailed guideSaved article and research bookmarks reached through the header's Bookmarks button.
Read detailed guideThe header Notifications bell opens administrative app announcements, separate from market push-alert subscriptions.
Read detailed guideA quiet market-facts card with a short multiple-choice prompt that appears beside a panel while it is still loading.
Read detailed guideA browser-dependent Install App entry with either a native install prompt or instructions for adding the terminal to a home screen.
Read detailed guideHow to read market scope, report dates, IST times, Indian-number units and the limits of the guide's historical examples.
Read detailed guideA practical path for distinguishing unselected inputs, no matches, missing imports, expired access and failed requests.
Read detailed guideProfile controls for device push enablement, notification categories and stock subscriptions, separate from app announcements.
Read detailed guideThese figures appeared in the captured terminal. Each lens answers a different question; none is a recommendation.
₹1,324.40; RSI14 68.76; ADX14 29.92. Read the candle series and indicator definitions, not a buy/sell instruction.
Read guideThe chart snapshot displayed SMA200 ₹1,324.04, close to price. Proximity to an average does not guarantee support.
Read guideReported funded quantity 3,82,26,017; value ₹4,856.10 Cr. This is funding exposure, not the same measure as delivery.
Read guide₹3,302.40, +5.41%, 5.5× volume, score 71 in the captured table. Check the session date before comparing.
Read guidePrice and volume meet a simple +5% / 5× illustration. They do not establish every breakout, RSI or ADX condition.
Read guideOpen GLAND to inspect its own candles. A high-volume gain alone does not explain the cause or predict the next session.
Read guideThe row flagged Gap Up and 12 large deals. Read each reason rather than treating the score as a probability.
Read guideInvestigate LUPIN’s dated deal records separately. A print without a reported side cannot be counted as informed buying.
Read guideCaptured spot 25,044.65; ATM 25,050. Select the underlying and expiry before comparing strikes.
Read guideUnderlying OI PCR 1.07 and max pain 25,000. These are positioning summaries, not a settlement forecast.
Read guide24950 PE: premium down 98.05%, OI up 1,19,87,235. Conventionally short buildup in that put contract, not proof of index direction.
Read guideNo market predictions here. Just a quick check that you know where to look next.